Liberty Street Economics
If Prices Fall, Mortgage Foreclosures Will Rise
In our previous post, we illustrated the recent extraordinarily strong growth in home prices and explored some of its key spatial patterns. Such price increases remind many of the first decade of the 2000s when home prices reversed, contributing to a broad housing market collapse that led to a wave of foreclosures, a financial crisis, and a prolonged recession. This post explores the risk that such an event could recur if home prices go into reverse now. We find that although the situation looks superficially similar to the brink of the last crisis, there are important differences that are likely to mitigate the risks emanating from the housing sector.
Same Old Story?
Our last post demonstrated that price increases have been unusually strong and are now at rates not seen since just prior to their peak in 2005 at 16 percent year-over-year. Prices then fell 20 percent between mid-2006 and early 2009. By 2012 the average home had lost about a quarter of its 2006 value. Because prices had risen and fallen so fast, new mortgage originations in the period leading up to the peak, including those with substantial down payments, were quickly put into negative equity, which is a major risk factor for foreclosure, as both academic research and the experience of 2007-11 demonstrate.
Are developments in the housing market now essentially the same? Well prices have certainly been rising very fast, and mortgage originations have also been strong. The former, however, has outpaced the latter in recent months. Additionally, the owner’s share of housing wealth is 67 percent as of the first quarter of 2021, its highest value since 1989. (This is the value of the property minus the debt owed on it, expressed as a share of the property value.) Note that during the previous housing boom (1995-2006) this measure didn’t rise, in spite of sharply rising home prices. Additional borrowing was large enough to keep the owner’s share roughly constant at about 61 percent.
Of course this is an aggregate figure, and the distribution of leverage is a more important indicator of risks in the housing market. To examine this, we use the method developed in this Economic Policy Review article to assess current risks in the housing market at the property level. We begin by providing an updated Combined Loan to Value (CLTV) ratio for a large sample of mortgaged properties in the United States, using sale or appraised values at mortgage origination and estimating price appreciation using the CoreLogic Home Price Index. A property’s CLTV is the value of all debt secured by the property, divided by the value of the property, and is thus equal to 100 percent minus the owner’s equity as a share of the property value. The next chart shows the updated distribution of CLTV across current mortgage borrowers through December 2020. Note that our data set is limited to mortgage borrowers and thus excludes all properties owned “free and clear” (with no mortgage).
The Current Distribution of Mortgage Performance Indicators
Each color in the chart below corresponds to a CLTV level: light blue and dark gray correspond to properties that are in negative equity—a CLTV over 100 percent – while light gray, gold, and dark blue reflect decreasing leverage levels. As the chart shows, negative equity is very rare now, while more than 85 percent of all properties have a CLTV<80, meaning they have at least a 20 percent equity cushion. This sounds quite comforting: households generally have a lot of equity in their properties. However, the situation was much the same in 2005. We can look deeper into another indicator that complements equity position and shows a difference between now and 2005: credit score.
A Small Share of Properties Have High (>80%) Combined Loan to Value Ratios
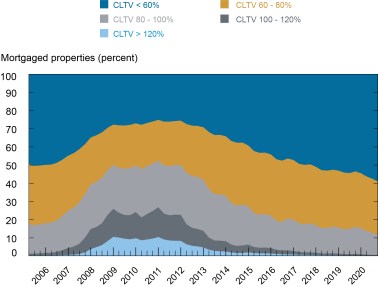
Source: Authors’ calculations using data from CoreLogic and Equifax Credit Risk Insight Servicing McDash.
Credit score is another strong predictor of mortgage performance for borrowers, conditional on their equity position. While the CLTV distribution in 2020 looks quite similar to that in 2005, the credit score distribution definitely does not. More than two-thirds of mortgage debt in 2020 was held by borrowers with a FICO score above 740, compared to just over 50 percent on the eve of the housing crisis in the early 2000s. Perhaps more importantly, about 10 percent of current debt is owed by borrowers with a current score below 660, compared with nearly 20 percent in early 2006.
What if Prices Fall?
In order to fully understand the riskiness of this stock of debt, we go one step further by calculating expected delinquency transitions under various adverse price scenarios. Those scenarios are described in the table below and include prices which revert to their level from two years ago (HPI-2) and four years ago (HPI-4) in each county. (In cases where the stress scenario produces an increase in prices, we set price change to zero.) These scenarios are fairly severe in light of strong recent price growth – the median county would see prices fall by more than 27 percent under HPI-4 . Even the 10 percent least affected counties would see double-digit declines.
Stressed Home Price Scenarios
| Price Scenario | Price Scenario | |
|---|---|---|
| HPI-2 | HPI-4 | |
| Δ P, 10th percentile | -16.6% | –27.6% |
| Δ P, 50th percentile | -11.9 | -20.7 |
| Δ P, 90th percentile | -7.8 | -13.1 |
| Max State Decline | Idaho | Idaho, Utah |
Source: Authors’ calculations based on data from CoreLogic.
What can we say about how mortgage performance would evolve under these scenarios? To start with, the price declines would drive many borrowers into negative equity, putting them at risk of default. Because of strong price growth since 2016, we estimate that Idaho, Utah, Nevada, and Arizona would all experience negative equity rates of more than 30 percent under HPI-4.
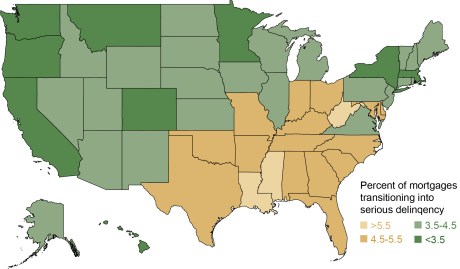
Yet the favorable credit score distribution would ameliorate the effects of these price declines on mortgage defaults. In the maps below, we show expected mortgage default rates under the two scenarios. More specifically, the maps show the 24-month transition rates for loans that were current (and not in forbearance) as of December 2020. To estimate these transitions, we use default rates from the 2007-10 period for each CLTV and FICO score combination, as described in Chart 12 of this paper. We estimate that 3.9 percent of mortgage balances overall would transition to delinquency by December 2022 under HPI-2 and 5.1 percent under HPI-4. These figures would be a significant increase in defaults over those observed in recent years, but they would fall far below the double-digit default rates observed during the crisis, when price declines were more severe, and the credit distribution was far less favorable.
As the maps show, however, there is significant geographic dispersion in the expected default rates. Relatively high rates of delinquency transitions appear in some expected places—Arizona, Florida, and Nevada are all above average risk for the HPI-2 and HPI-4 scenarios. But California is now at below average risk from these shocks, while Georgia, Idaho, Indiana, Mississippi, and Utah have emerged as newly vulnerable, given strong recent price growth in many of those states. Still, none of these states would be expected to match the national average default rates observed during the crisis, let alone the very high rates witnessed in Arizona, California, Florida, and Nevada.
24-month Serious Delinquency Forecasts: HPI 2 Years Ago
24-month Serious Delinquency Forecasts: HPI 4 Years Ago
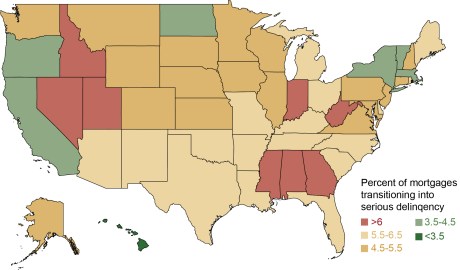
Source: Authors’ calculations using data from CoreLogic and Equifax Credit Risk Insight Servicing McDash.
There is at least one caveat to this fairly benign scenario: mortgage forbearances. As noted above, our default estimates exclude loans already in forbearance. Those represent about 2.7 percent of loans in June 2020. Because widespread forbearance is a new approach to avoiding default and foreclosure, little is known about how these borrowers will fare when the programs end. Some share will likely be able to resume making payments, while others may have to sell their homes. Given strong price growth and very tight for-sale inventories of housing, these borrowers will generally have positive equity if they have to sell, enabling them to pay off their loans and avoid default. Nonetheless, the transition out of these programs is one additional factor to keep track of when monitoring housing risk.
Full Link: https://libertystreeteconomics.newyorkfed.org/2021/09/if-prices-fall-mortgage-foreclosures-will-rise/?utm_source=ActiveCampaign&utm_medium=email&utm_content=%F0%9F%93%88+Foreclosures+jump+another+27++in+August&utm_campaign=Newsletter


Leave A Comment